NAVSIM retrieval · what counts as a correct neighbour
Green criterion: which distance, which threshold
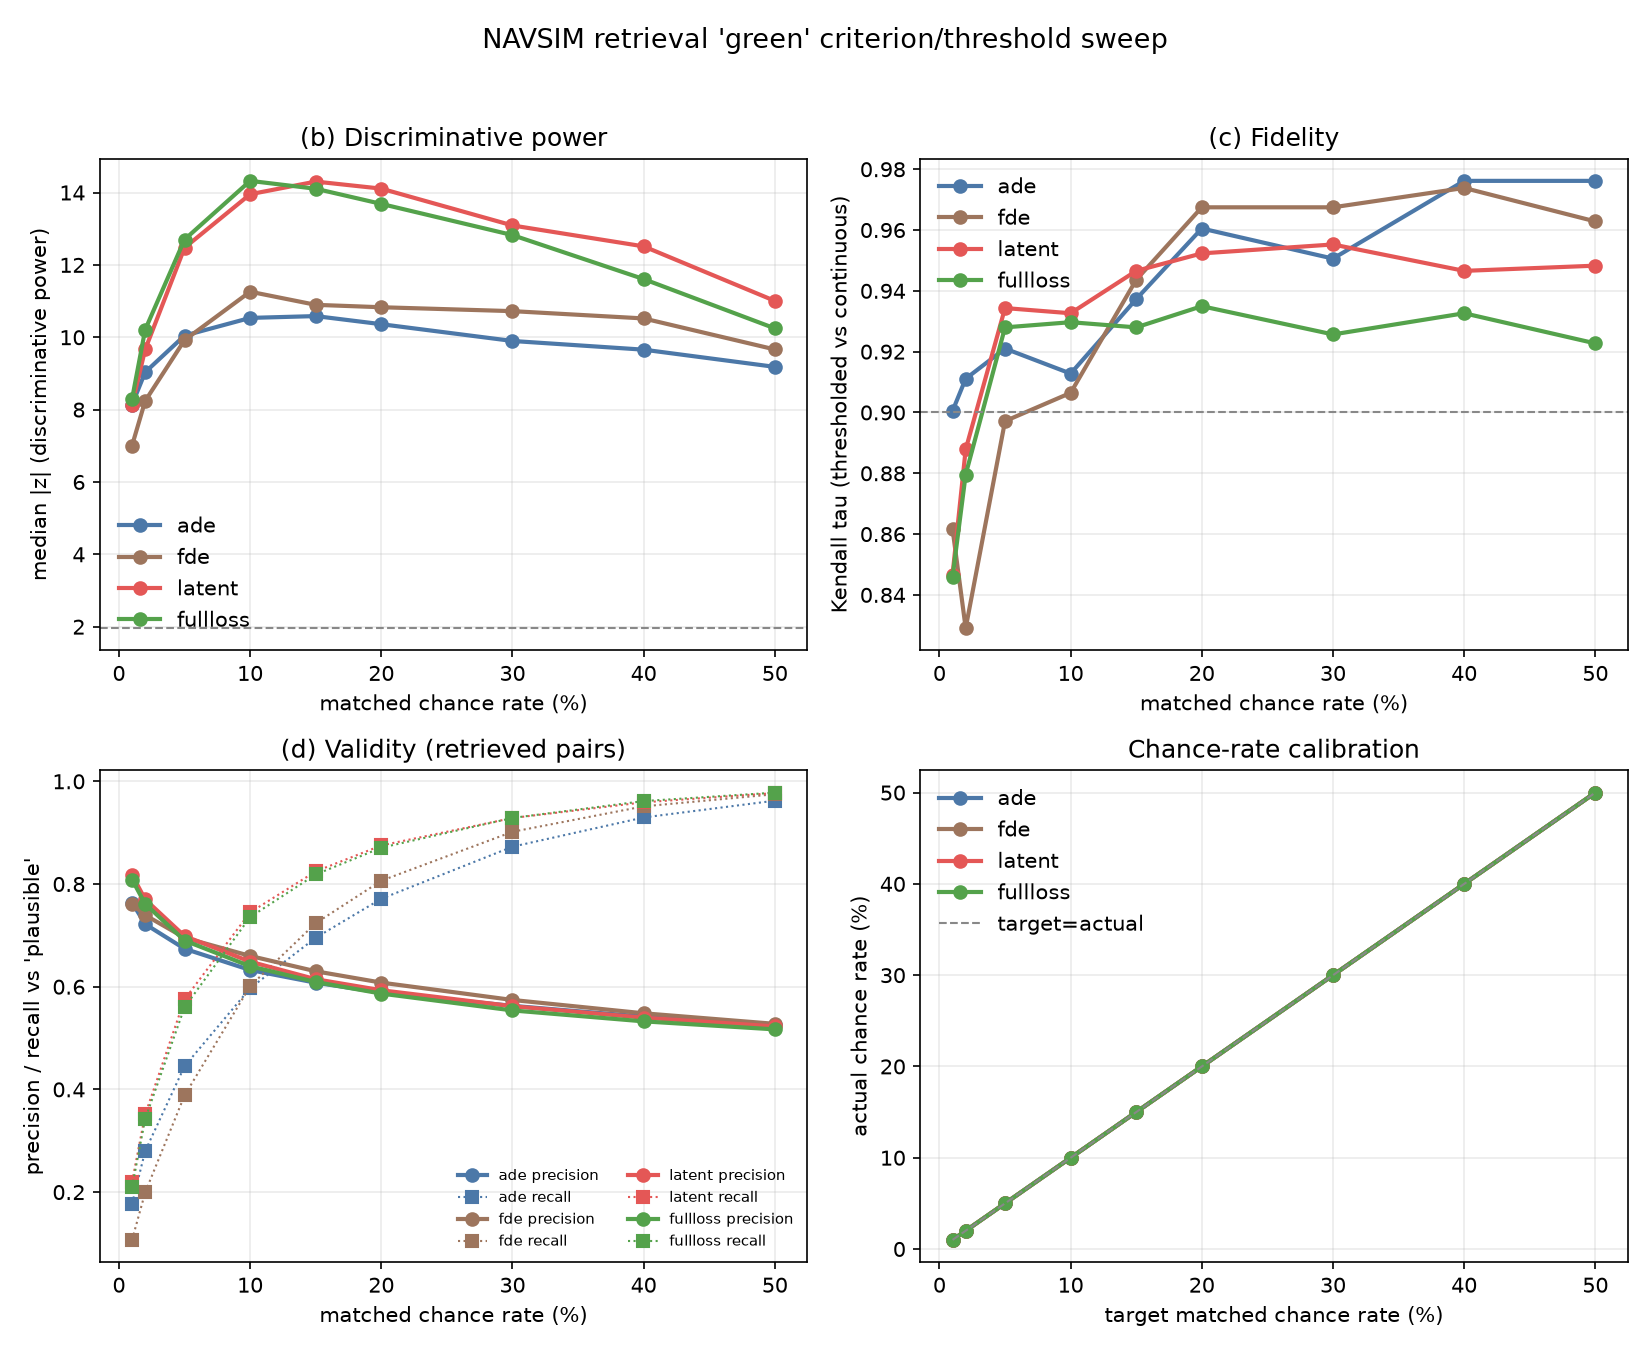
A retrieved neighbour is “green” when its ground-truth 4 s future is close to the query’s. This page tests four ways of measuring “close” over many thresholds, using every descriptor variant in the benchmark (2,000 queries, top-10 out of 12,146 navtest scenes, own log excluded). Both futures are GT, 8 waypoints at 0.5 s, each in its own t0 ego frame.
Result
- Recommended: speed-latent distance ≤ 0.59 (10% of random scene pairs pass). It separates models with median |z| = 14.0, against 10.5 for today’s ADE ≤ 2 m (8.0% chance).
- Best ADE threshold: flat between about 1.6 and 3.4 m. Today’s 2 m is already at the optimum, and above about 3.4 m it saturates (the best model reaches 9.75 of 10).
- The speed latent beats ADE at every chance rate from 2% to 50%, by up to +3.75 in median |z|. The full training loss ties the latent but needs a fitted scale factor between its two terms, so the latent alone is simpler.
- The model ranking barely changes (Kendall τ ≥ 0.93 against the continuous distance), so earlier conclusions still hold. Under the latent, every model gets about 1–2 more green neighbours.
How the criteria are compared
- Matched chance rate. The criteria have different units, so each threshold is set to the quantile of the distance between random cross-log scene pairs that gives the same chance rate. Comparing at equal chance rate is the fair test.
- Separating power = median |z| of the paired per-query difference in green count, over all 80 within-pipeline variant pairs. Higher means real differences between models show up more reliably.
- Ranking fidelity = Kendall τ between the variant ranking by green count and by the same distance left continuous.
- Validity = AUC for predicting a rule-based “plausible” label (same manoeuvre: stop / left / right / straight, plus the same speed tertile). The label is derived from the same trajectories and includes speed, which favours the latent, so treat it as a sanity check, not ground truth.
- Speed latent = L1 distance between the frozen velocity-autoencoder codes of the two whitened velocity sequences, the term our training loss uses. Full loss = 0.7 × latent + 0.3 × 5.083 × Huber on normalised positions (one global scale factor). The autoencoder reconstructs navtest futures with an error of 0.759 vs 0.738 (navtest vs its own training data), so it is valid on navtest.
All four criteria at matched chance rates
Green row = recommended setting. Best / worst = mean green count out of 10 for the best and worst variant (saturation check).
| Criterion | Chance | Threshold | Separating power | Significant | τ | Validity AUC | Best / worst |
|---|---|---|---|---|---|---|---|
| ADE (m) | 5% | 1.58 | 10.0 | 64/80 | 0.921 | 0.705 | 7.36 / 2.19 |
| ADE (m) | 10% | 2.25 | 10.5 | 63/80 | 0.913 | 0.705 | 8.88 / 3.38 |
| ADE (m) | 15% | 2.84 | 10.6 | 63/80 | 0.937 | 0.705 | 9.46 / 4.30 |
| ADE (m) | 20% | 3.44 | 10.4 | 64/80 | 0.961 | 0.705 | 9.75 / 5.07 |
| FDE (m) | 5% | 2.39 | 9.9 | 61/80 | 0.897 | 0.728 | 5.65 / 1.86 |
| FDE (m) | 10% | 3.95 | 11.3 | 62/80 | 0.906 | 0.728 | 8.00 / 3.25 |
| FDE (m) | 15% | 5.29 | 10.9 | 62/80 | 0.944 | 0.728 | 9.02 / 4.28 |
| FDE (m) | 20% | 6.51 | 10.8 | 62/80 | 0.967 | 0.728 | 9.48 / 5.09 |
| Speed latent (L1) | 5% | 0.43 | 12.5 | 63/80 | 0.934 | 0.756 | 7.23 / 2.66 |
| Speed latent (L1) | 10% | 0.59 | 14.0 | 65/80 | 0.933 | 0.756 | 8.59 / 3.96 |
| Speed latent (L1) | 15% | 0.71 | 14.3 | 66/80 | 0.947 | 0.756 | 9.16 / 4.85 |
| Speed latent (L1) | 20% | 0.82 | 14.1 | 64/80 | 0.952 | 0.756 | 9.43 / 5.54 |
| Full training loss | 5% | 0.39 | 12.7 | 63/80 | 0.928 | 0.745 | 7.39 / 2.57 |
| Full training loss | 10% | 0.55 | 14.3 | 66/80 | 0.930 | 0.745 | 8.74 / 3.94 |
| Full training loss | 15% | 0.67 | 14.1 | 63/80 | 0.928 | 0.745 | 9.26 / 4.86 |
| Full training loss | 20% | 0.78 | 13.7 | 65/80 | 0.935 | 0.745 | 9.52 / 5.60 |
Speed latent vs ADE, head to head
| Chance | ADE power | Latent power | Latent − ADE | ADE precision | Latent precision |
|---|---|---|---|---|---|
| 1% | 8.1 | 8.1 | +0.00 | 0.764 | 0.818 |
| 2% | 9.0 | 9.7 | +0.63 | 0.722 | 0.770 |
| 5% | 10.0 | 12.5 | +2.43 | 0.674 | 0.699 |
| 10% | 10.5 | 14.0 | +3.42 | 0.632 | 0.649 |
| 15% | 10.6 | 14.3 | +3.72 | 0.608 | 0.615 |
| 20% | 10.4 | 14.1 | +3.75 | 0.589 | 0.593 |
| 30% | 9.9 | 13.1 | +3.19 | 0.563 | 0.562 |
| 40% | 9.7 | 12.5 | +2.86 | 0.542 | 0.540 |
| 50% | 9.2 | 11.0 | +1.82 | 0.525 | 0.523 |
ADE threshold in metres
Amber row = the current gallery setting.
| ADE ≤ | Chance | Power | Significant | τ | Best / worst |
|---|---|---|---|---|---|
| 0.25 m | 0.1% | 3.8 | 55/80 | 0.859 | 0.61 / 0.07 |
| 0.50 m | 0.5% | 6.6 | 64/80 | 0.884 | 2.06 / 0.37 |
| 0.75 m | 1.1% | 8.1 | 63/80 | 0.893 | 3.64 / 0.77 |
| 1.00 m | 2.0% | 9.0 | 67/80 | 0.913 | 5.06 / 1.20 |
| 1.50 m | 4.5% | 9.9 | 66/80 | 0.921 | 7.11 / 2.06 |
| 2.00 m (current) | 8.0% | 10.5 | 65/80 | 0.906 | 8.44 / 2.95 |
| 2.50 m | 12.0% | 10.7 | 62/80 | 0.921 | 9.18 / 3.77 |
| 3.00 m | 16.3% | 10.5 | 63/80 | 0.934 | 9.55 / 4.52 |
| 4.00 m | 24.7% | 10.3 | 64/80 | 0.954 | 9.88 / 5.71 |
| 5.00 m | 32.9% | 10.0 | 63/80 | 0.958 | 9.97 / 6.58 |
| 6.00 m | 40.9% | 9.6 | 64/80 | 0.977 | 9.99 / 7.29 |
| 8.00 m | 55.5% | 8.8 | 62/80 | 0.965 | 10.00 / 8.22 |
| 10.00 m | 67.6% | 7.8 | 60/80 | 0.955 | 10.00 / 8.86 |
Speed-latent threshold
Raw L1 distance in latent units.
| Latent ≤ | Chance | Power | Significant | τ | Best / worst |
|---|---|---|---|---|---|
| 0.21 | 1.0% | 8.1 | 60/80 | 0.847 | 3.33 / 0.78 |
| 0.27 | 1.8% | 9.4 | 61/80 | 0.885 | 4.63 / 1.25 |
| 0.34 | 3.0% | 11.5 | 63/80 | 0.905 | 6.01 / 1.87 |
| 0.43 | 5.1% | 12.3 | 64/80 | 0.935 | 7.29 / 2.70 |
| 0.55 | 8.6% | 13.9 | 65/80 | 0.935 | 8.35 / 3.67 |
| 0.70 | 14.4% | 14.2 | 66/80 | 0.949 | 9.12 / 4.77 |
| 0.89 | 23.7% | 13.7 | 64/80 | 0.962 | 9.57 / 5.95 |
| 1.14 | 37.0% | 12.6 | 60/80 | 0.944 | 9.81 / 7.14 |
| 1.44 | 53.5% | 10.7 | 63/80 | 0.939 | 9.92 / 8.17 |
| 1.84 | 70.7% | 7.9 | 64/80 | 0.904 | 9.97 / 9.04 |
| 2.34 | 85.2% | 5.4 | 61/80 | 0.876 | 9.99 / 9.57 |
| 2.98 | 95.0% | 3.2 | 49/80 | 0.808 | 10.00 / 9.83 |
| 3.79 | 99.0% | 2.4 | 51/80 | 0.705 | 10.00 / 9.93 |
Curves